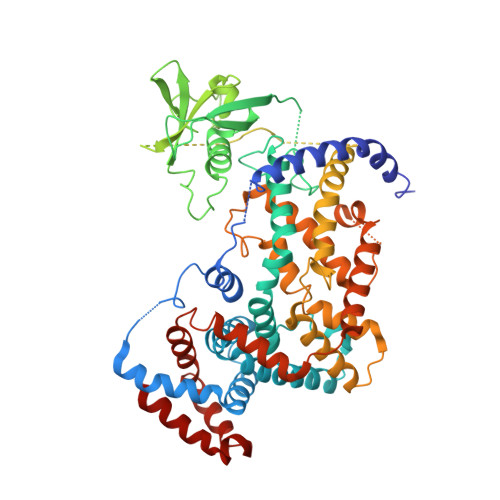
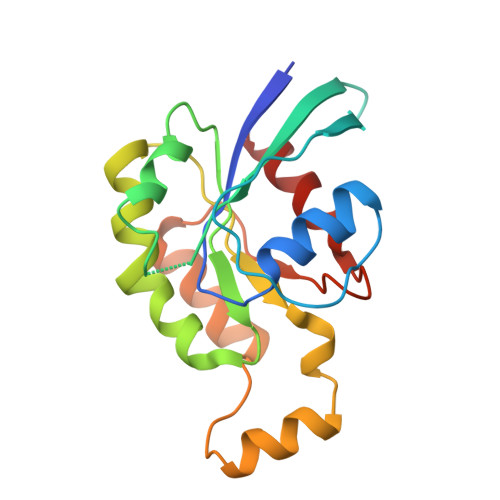
3RYT

The Plexin A1 intracellular region in complex with Rac1


Experimental Data Snapshot

  • Method: X-RAY DIFFRACTION
  • Resolution: 3.58 Å
  • R-Value Free: 0.340 
  • R-Value Work: 0.270 
  • R-Value Observed: 0.270 

Starting Models: experimental
View more details

wwPDB Validation   3D Report Full Report


Ligand Structure Quality Assessment 


This is version 1.2 of the entry. See complete history


Literature

Plexins Are GTPase-Activating Proteins for Rap and Are Activated by Induced Dimerization.

Wang, Y.He, H.Srivastava, N.Vikarunnessa, S.Chen, Y.B.Jiang, J.Cowan, C.W.Zhang, X.

(2012) Sci Signal 5: ra6-ra6

  • DOI: https://doi.org/10.1126/scisignal.2002636
  • Primary Citation of Related Structures:  
    3RYT

  • PubMed Abstract: 

    Plexins are cell surface receptors that bind to semaphorins and transduce signals that regulate neuronal development, immune responses, and other processes. Signaling through plexins has been proposed to rely on specific guanosine triphosphatase (GTPase)-activating protein (GAP) activity for R-Ras and M-Ras. Activation of this GAP activity of plexins appears to require simultaneous binding of semaphorin to the plexin extracellular domain and of the Rho GTPases Rac1 or Rnd1 to the cytoplasmic region. However, GAP activity of plexins has eluded detection in several recent studies. We show that the purified cytoplasmic region of plexin uses a noncanonical catalytic mechanism to act as a GAP for Rap, but not for R-Ras or M-Ras. The RapGAP activity of plexins was autoinhibited and was activated by induced dimerization. Biochemical and crystallographic analyses demonstrated that binding of Rho GTPases did not directly contribute to activation of plexin RapGAP activity. Semaphorin stimulated the RapGAP activity of full-length plexin in cells, which was required for plexin-mediated neuronal growth cone collapse. Together, these findings define a pathway for plexin signaling and provide insights into the mechanism for semaphorin-induced activation of plexins.


  • Organizational Affiliation

    Department of Pharmacology, University of Texas Southwestern Medical Center, Dallas, TX 75063, USA.


Macromolecules
Find similar proteins by:  (by identity cutoff)  |  3D Structure
Entity ID: 1
MoleculeChains Sequence LengthOrganismDetailsImage
Plexin-A1
A, B
626Mus musculusMutation(s): 0 
Gene Names: Kiaa4053Plexin A1Plxna1
UniProt
Find proteins for P70206 (Mus musculus)
Explore P70206 
Go to UniProtKB:  P70206
Entity Groups  
Sequence Clusters30% Identity50% Identity70% Identity90% Identity95% Identity100% Identity
UniProt GroupP70206
Sequence Annotations
Expand
  • Reference Sequence
Find similar proteins by:  (by identity cutoff)  |  3D Structure
Entity ID: 2
MoleculeChains Sequence LengthOrganismDetailsImage
Ras-related C3 botulinum toxin substrate 1180Homo sapiensMutation(s): 1 
Gene Names: MIG5RAC1TC25
EC: 3.6.5.2
UniProt & NIH Common Fund Data Resources
Find proteins for P63000 (Homo sapiens)
Explore P63000 
Go to UniProtKB:  P63000
PHAROS:  P63000
GTEx:  ENSG00000136238 
Entity Groups  
Sequence Clusters30% Identity50% Identity70% Identity90% Identity95% Identity100% Identity
UniProt GroupP63000
Sequence Annotations
Expand
  • Reference Sequence
Small Molecules
Ligands 2 Unique
IDChains Name / Formula / InChI Key2D Diagram3D Interactions
GNP
Query on GNP

Download Ideal Coordinates CCD File 
E [auth C]PHOSPHOAMINOPHOSPHONIC ACID-GUANYLATE ESTER
C10 H17 N6 O13 P3
UQABYHGXWYXDTK-UUOKFMHZSA-N
MG
Query on MG

Download Ideal Coordinates CCD File 
D [auth C]MAGNESIUM ION
Mg
JLVVSXFLKOJNIY-UHFFFAOYSA-N
Experimental Data & Validation

Experimental Data

  • Method: X-RAY DIFFRACTION
  • Resolution: 3.58 Å
  • R-Value Free: 0.340 
  • R-Value Work: 0.270 
  • R-Value Observed: 0.270 
  • Space Group: P 43 21 2
Unit Cell:
Length ( Å )Angle ( ˚ )
a = 110.783α = 90
b = 110.783β = 90
c = 265.628γ = 90
Software Package:
Software NamePurpose
HKL-2000data collection
PHASERphasing
PHENIXrefinement
HKL-2000data reduction
HKL-2000data scaling

Structure Validation

View Full Validation Report


Ligand Structure Quality Assessment 


Entry History 

Deposition Data

Revision History  (Full details and data files)

  • Version 1.0: 2012-01-18
    Type: Initial release
  • Version 1.1: 2012-02-01
    Changes: Database references
  • Version 1.2: 2023-09-13
    Changes: Data collection, Database references, Derived calculations, Refinement description