4OR0 | pdb_00004or0

Crystal Structure of Bovine Serum Albumin in complex with naproxen


Experimental Data Snapshot

  • Method: X-RAY DIFFRACTION
  • Resolution: 2.58 Å
  • R-Value Free: 
    0.257 (Depositor), 0.268 (DCC) 
  • R-Value Work: 
    0.183 (Depositor) 
  • R-Value Observed: 
    0.185 (Depositor) 

Starting Model: experimental
View more details

wwPDB Validation 3D Report Full Report

Validation slider image for 4OR0

Ligand Structure Quality Assessment 


This is version 1.3 of the entry. See complete history

Literature

Structural studies of bovine, equine, and leporine serum albumin complexes with naproxen.

Bujacz, A.Zielinski, K.Sekula, B.

(2014) Proteins 82: 2199-2208

  • DOI: https://doi.org/10.1002/prot.24583
  • Primary Citation Related Structures: 
    4OR0, 4OT2, 4PO0

  • PubMed Abstract: 

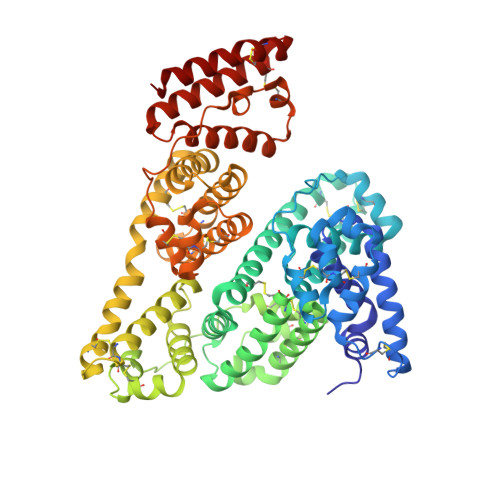
    Serum albumin, a protein naturally abundant in blood plasma, shows remarkable ligand binding properties of numerous endogenous and exogenous compounds. Most of serum albumin binding sites are able to interact with more than one class of ligands. Determining the protein-ligand interactions among mammalian serum albumins is essential for understanding the complexity of this transporter. We present three crystal structures of serum albumins in complexes with naproxen (NPS): bovine (BSA-NPS), equine (ESA-NPS), and leporine (LSA-NPS) determined to 2.58 Å (C2), 2.42 Å (P61), and 2.73 Å (P2₁2₁2₁) resolutions, respectively. A comparison of the structurally investigated complexes with the analogous complex of human serum albumin (HSA-NPS) revealed surprising differences in the number and distribution of naproxen binding sites. Bovine and leporine serum albumins possess three NPS binding sites, but ESA has only two. All three complexes of albumins studied here have two common naproxen locations, but BSA and LSA differ in the third NPS binding site. None of these binding sites coincides with the naproxen location in the HSA-NPS complex, which was obtained in the presence of other ligands besides naproxen. Even small differences in sequences of serum albumins from various species, especially in the area of the binding pockets, influence the affinity and the binding mode of naproxen to this transport protein.


  • Organizational Affiliation
    • Institute of Technical Biochemistry, Faculty of Biotechnology and Food Sciences, Lodz University of Technology, Stefanowskiego 4/10, 90-924, Lodz, Poland.

Macromolecule Content 

  • Total Structure Weight: 134.76 kDa 
  • Atom Count: 9,508 
  • Modeled Residue Count: 1,164 
  • Deposited Residue Count: 1,166 
  • Unique protein chains: 1

Macromolecules

Find similar proteins by:|  3D Structure
Entity ID: 1
MoleculeChains  Sequence LengthOrganismDetailsImage
Serum albumin
A, B
583Bos taurusMutation(s): 1 
UniProt
Find proteins for P02769 (Bos taurus)
Explore P02769 
Go to UniProtKB:  P02769
Entity Groups
Sequence Clusters30% Identity50% Identity70% Identity90% Identity95% Identity100% Identity
UniProt GroupP02769
Sequence Annotations
Expand
Reference Sequence

Small Molecules

Ligands 3 Unique
IDChains Name / Formula / InChI Key2D Diagram3D Interactions
NPS

Query on NPS


Download:Ideal Coordinates CCD File
C [auth A]
D [auth A]
E [auth A]
H [auth B]
I [auth B]
C [auth A],
D [auth A],
E [auth A],
H [auth B],
I [auth B],
J [auth B]
(2S)-2-(6-methoxynaphthalen-2-yl)propanoic acid
C14 H14 O3
CMWTZPSULFXXJA-VIFPVBQESA-N
PGE

Query on PGE


Download:Ideal Coordinates CCD File
F [auth A]TRIETHYLENE GLYCOL
C6 H14 O4
ZIBGPFATKBEMQZ-UHFFFAOYSA-N
PEG

Query on PEG


Download:Ideal Coordinates CCD File
G [auth A]DI(HYDROXYETHYL)ETHER
C4 H10 O3
MTHSVFCYNBDYFN-UHFFFAOYSA-N

Experimental Data & Validation

Experimental Data

  • Method: X-RAY DIFFRACTION
  • Resolution: 2.58 Å
  • R-Value Free:  0.257 (Depositor), 0.268 (DCC) 
  • R-Value Work:  0.183 (Depositor) 
  • R-Value Observed: 0.185 (Depositor) 
Space Group: C 1 2 1
Unit Cell:
Length ( Å )Angle ( ˚ )
a = 216.043α = 90
b = 44.897β = 113.99
c = 141.699γ = 90
Software Package:
Software NamePurpose
DNAdata collection
MOLREPphasing
REFMACrefinement
XDSdata reduction
XDSdata scaling
REFMACphasing

Structure Validation

View Full Validation Report


Ligand Structure Quality Assessment 


Entry History 

Deposition Data

Revision History  (Full details and data files)

  • Version 1.0: 2014-06-04
    Type: Initial release
  • Version 1.1: 2014-09-10
    Changes: Database references
  • Version 1.2: 2023-09-20
    Changes: Data collection, Database references, Derived calculations, Refinement description
  • Version 1.3: 2024-11-20
    Changes: Structure summary