5C0C

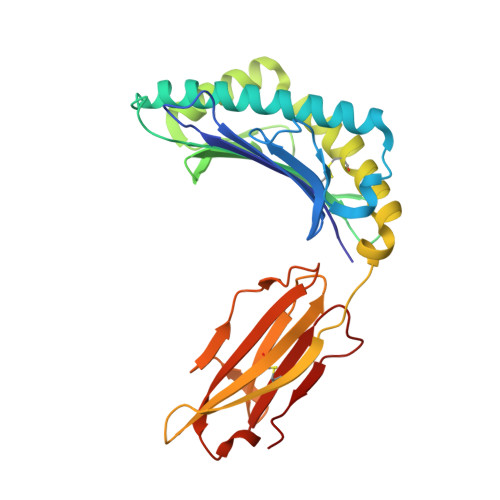
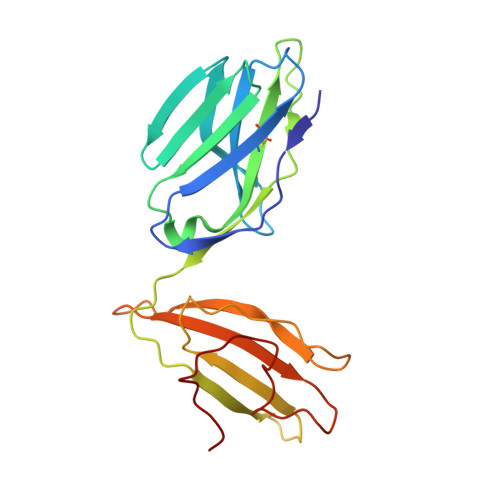
1E6 TCR in complex with HLA-A02 carrying RQFGPDWIVA


Experimental Data Snapshot

  • Method: X-RAY DIFFRACTION
  • Resolution: 1.97 Å
  • R-Value Free: 0.227 
  • R-Value Work: 0.189 
  • R-Value Observed: 0.190 

Starting Models: experimental
View more details

wwPDB Validation   3D Report Full Report


This is version 1.3 of the entry. See complete history


Literature

Hotspot autoimmune T cell receptor binding underlies pathogen and insulin peptide cross-reactivity.

Cole, D.K.Bulek, A.M.Dolton, G.Schauenberg, A.J.Szomolay, B.Rittase, W.Trimby, A.Jothikumar, P.Fuller, A.Skowera, A.Rossjohn, J.Zhu, C.Miles, J.J.Peakman, M.Wooldridge, L.Rizkallah, P.J.Sewell, A.K.

(2016) J Clin Invest 126: 2191-2204

  • DOI: https://doi.org/10.1172/JCI85679
  • Primary Citation of Related Structures:  
    5C07, 5C08, 5C09, 5C0A, 5C0B, 5C0C, 5C0D, 5C0E, 5C0F, 5C0G, 5C0I, 5C0J, 5N1Y

  • PubMed Abstract: 

    The cross-reactivity of T cells with pathogen- and self-derived peptides has been implicated as a pathway involved in the development of autoimmunity. However, the mechanisms that allow the clonal T cell antigen receptor (TCR) to functionally engage multiple peptide-major histocompatibility complexes (pMHC) are unclear. Here, we studied multiligand discrimination by a human, preproinsulin reactive, MHC class-I-restricted CD8+ T cell clone (1E6) that can recognize over 1 million different peptides. We generated high-resolution structures of the 1E6 TCR bound to 7 altered peptide ligands, including a pathogen-derived peptide that was an order of magnitude more potent than the natural self-peptide. Evaluation of these structures demonstrated that binding was stabilized through a conserved lock-and-key-like minimal binding footprint that enables 1E6 TCR to tolerate vast numbers of substitutions outside of this so-called hotspot. Highly potent antigens of the 1E6 TCR engaged with a strong antipathogen-like binding affinity; this engagement was governed though an energetic switch from an enthalpically to entropically driven interaction compared with the natural autoimmune ligand. Together, these data highlight how T cell cross-reactivity with pathogen-derived antigens might break self-tolerance to induce autoimmune disease.


Macromolecules
Find similar proteins by:  (by identity cutoff)  |  3D Structure
Entity ID: 1
MoleculeChains Sequence LengthOrganismDetailsImage
HLA class I histocompatibility antigen, A-2 alpha chain
A, F
277Homo sapiensMutation(s): 0 
Gene Names: HLA-AHLAA
UniProt & NIH Common Fund Data Resources
Find proteins for P04439 (Homo sapiens)
Explore P04439 
Go to UniProtKB:  P04439
PHAROS:  P04439
GTEx:  ENSG00000206503 
Entity Groups  
Sequence Clusters30% Identity50% Identity70% Identity90% Identity95% Identity100% Identity
UniProt GroupP04439
Sequence Annotations
Expand
  • Reference Sequence
Find similar proteins by:  (by identity cutoff)  |  3D Structure
Entity ID: 2
MoleculeChains Sequence LengthOrganismDetailsImage
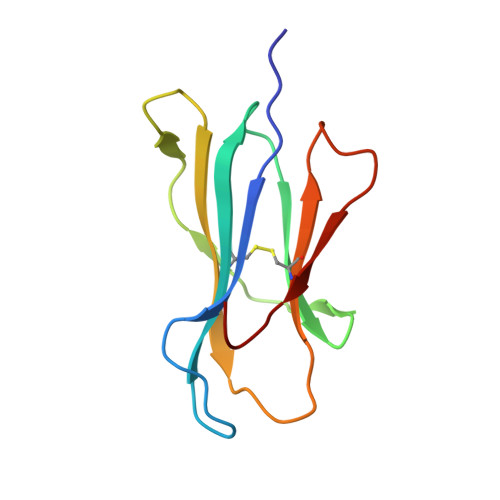
Beta-2-microglobulin
B, G
100Homo sapiensMutation(s): 0 
Gene Names: B2MCDABP0092HDCMA22P
UniProt & NIH Common Fund Data Resources
Find proteins for P61769 (Homo sapiens)
Explore P61769 
Go to UniProtKB:  P61769
PHAROS:  P61769
GTEx:  ENSG00000166710 
Entity Groups  
Sequence Clusters30% Identity50% Identity70% Identity90% Identity95% Identity100% Identity
UniProt GroupP61769
Sequence Annotations
Expand
  • Reference Sequence

Find similar proteins by:  Sequence   |   3D Structure  

Entity ID: 3
MoleculeChains Sequence LengthOrganismDetailsImage
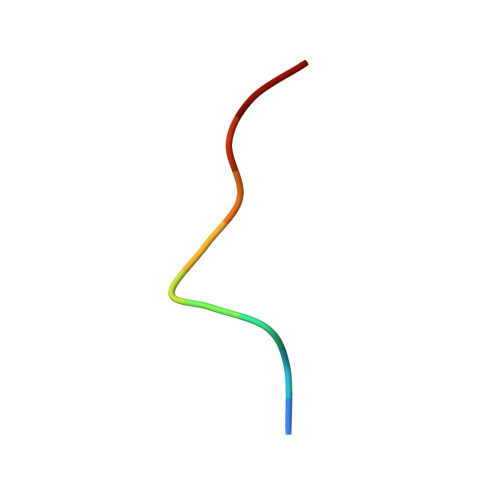
Marker peptide
C, H
10Homo sapiensMutation(s): 0 
Entity Groups  
Sequence Clusters30% Identity50% Identity70% Identity90% Identity95% Identity100% Identity
Sequence Annotations
Expand
  • Reference Sequence
Find similar proteins by:  (by identity cutoff)  |  3D Structure
Entity ID: 4
MoleculeChains Sequence LengthOrganismDetailsImage
1E6 TCR Alpha Chain
D, I
200Homo sapiensMutation(s): 0 
UniProt & NIH Common Fund Data Resources
Find proteins for A0A0B4J271 (Homo sapiens)
Explore A0A0B4J271 
Go to UniProtKB:  A0A0B4J271
PHAROS:  A0A0B4J271
GTEx:  ENSG00000211794 
Find proteins for P01848 (Homo sapiens)
Explore P01848 
Go to UniProtKB:  P01848
PHAROS:  P01848
Entity Groups  
Sequence Clusters30% Identity50% Identity70% Identity90% Identity95% Identity100% Identity
UniProt GroupsA0A0B4J271P01848
Sequence Annotations
Expand
  • Reference Sequence
Find similar proteins by:  (by identity cutoff)  |  3D Structure
Entity ID: 5
MoleculeChains Sequence LengthOrganismDetailsImage
1E6 TCR Beta Chain
E, J
247Homo sapiensMutation(s): 0 
UniProt & NIH Common Fund Data Resources
Find proteins for A0A0B4J2E0 (Homo sapiens)
Explore A0A0B4J2E0 
Go to UniProtKB:  A0A0B4J2E0
GTEx:  ENSG00000276953 
Find proteins for A0A5B9 (Homo sapiens)
Explore A0A5B9 
Go to UniProtKB:  A0A5B9
PHAROS:  A0A5B9
Entity Groups  
Sequence Clusters30% Identity50% Identity70% Identity90% Identity95% Identity100% Identity
UniProt GroupsA0A0B4J2E0A0A5B9
Sequence Annotations
Expand
  • Reference Sequence
Small Molecules
Ligands 4 Unique
IDChains Name / Formula / InChI Key2D Diagram3D Interactions
PG4
Query on PG4

Download Ideal Coordinates CCD File 
N [auth A],
PA [auth I]
TETRAETHYLENE GLYCOL
C8 H18 O5
UWHCKJMYHZGTIT-UHFFFAOYSA-N
SO4
Query on SO4

Download Ideal Coordinates CCD File 
O [auth A],
XA [auth J],
YA [auth J],
ZA [auth J]
SULFATE ION
O4 S
QAOWNCQODCNURD-UHFFFAOYSA-L
GOL
Query on GOL

Download Ideal Coordinates CCD File 
IA [auth F],
JA [auth F],
R [auth B]
GLYCEROL
C3 H8 O3
PEDCQBHIVMGVHV-UHFFFAOYSA-N
EDO
Query on EDO

Download Ideal Coordinates CCD File 
AA [auth E]
BA [auth F]
CA [auth F]
DA [auth F]
EA [auth F]
AA [auth E],
BA [auth F],
CA [auth F],
DA [auth F],
EA [auth F],
FA [auth F],
GA [auth F],
HA [auth F],
K [auth A],
KA [auth G],
L [auth A],
LA [auth G],
M [auth A],
MA [auth I],
NA [auth I],
OA [auth I],
P [auth B],
Q [auth B],
QA [auth J],
RA [auth J],
S [auth D],
SA [auth J],
T [auth D],
TA [auth J],
U [auth D],
UA [auth J],
V [auth E],
VA [auth J],
W [auth E],
WA [auth J],
X [auth E],
Y [auth E],
Z [auth E]
1,2-ETHANEDIOL
C2 H6 O2
LYCAIKOWRPUZTN-UHFFFAOYSA-N
Experimental Data & Validation

Experimental Data

  • Method: X-RAY DIFFRACTION
  • Resolution: 1.97 Å
  • R-Value Free: 0.227 
  • R-Value Work: 0.189 
  • R-Value Observed: 0.190 
  • Space Group: P 1
Unit Cell:
Length ( Å )Angle ( ˚ )
a = 43.92α = 96.9
b = 100.37β = 98.02
c = 122.73γ = 96.07
Software Package:
Software NamePurpose
SCALAdata scaling
PHASERphasing
REFMACrefinement
PDB_EXTRACTdata extraction
XDSdata reduction

Structure Validation

View Full Validation Report


Entry History 

Deposition Data

Revision History  (Full details and data files)

  • Version 1.0: 2016-05-04
    Type: Initial release
  • Version 1.1: 2016-05-25
    Changes: Database references
  • Version 1.2: 2016-06-08
    Changes: Database references
  • Version 1.3: 2024-01-10
    Changes: Data collection, Database references, Refinement description