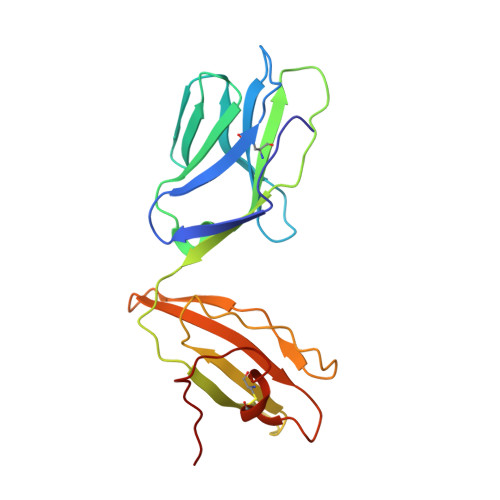
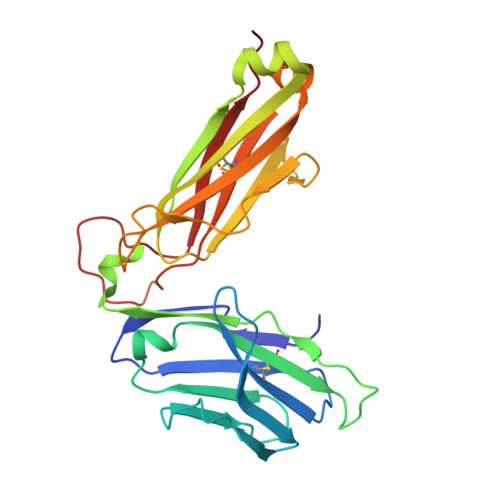
Natural micropolymorphism in human leukocyte antigens provides a basis for genetic control of antigen recognition.
Archbold, J.K., Macdonald, W.A., Gras, S., Ely, L.K., Miles, J.J., Bell, M.J., Brennan, R.M., Beddoe, T., Wilce, M.C., Clements, C.S., Purcell, A.W., McCluskey, J., Burrows, S.R., Rossjohn, J.(2009) J Exp Medicine 206: 209-219
- PubMed: 19139173
- DOI: https://doi.org/10.1084/jem.20082136
- Primary Citation of Related Structures:
3DX6, 3DX7, 3DX8, 3DX9, 3DXA - PubMed Abstract:
Human leukocyte antigen (HLA) gene polymorphism plays a critical role in protective immunity, disease susceptibility, autoimmunity, and drug hypersensitivity, yet the basis of how HLA polymorphism influences T cell receptor (TCR) recognition is unclear. We examined how a natural micropolymorphism in HLA-B44, an important and large HLA allelic family, affected antigen recognition. T cell-mediated immunity to an Epstein-Barr virus determinant (EENLLDFVRF) is enhanced when HLA-B*4405 was the presenting allotype compared with HLA-B*4402 or HLA-B*4403, each of which differ by just one amino acid. The micropolymorphism in these HLA-B44 allotypes altered the mode of binding and dynamics of the bound viral epitope. The structure of the TCR-HLA-B*4405(EENLLDFVRF) complex revealed that peptide flexibility was a critical parameter in enabling preferential engagement with HLA-B*4405 in comparison to HLA-B*4402/03. Accordingly, major histocompatibility complex (MHC) polymorphism can alter the dynamics of the peptide-MHC landscape, resulting in fine-tuning of T cell responses between closely related allotypes.
- The Protein Crystallography Unit, Department of Biochemistry and Molecular Biology, School of Biomedical Sciences, Monash University, Clayton, Victoria 3800, Australia.
Organizational Affiliation:


